
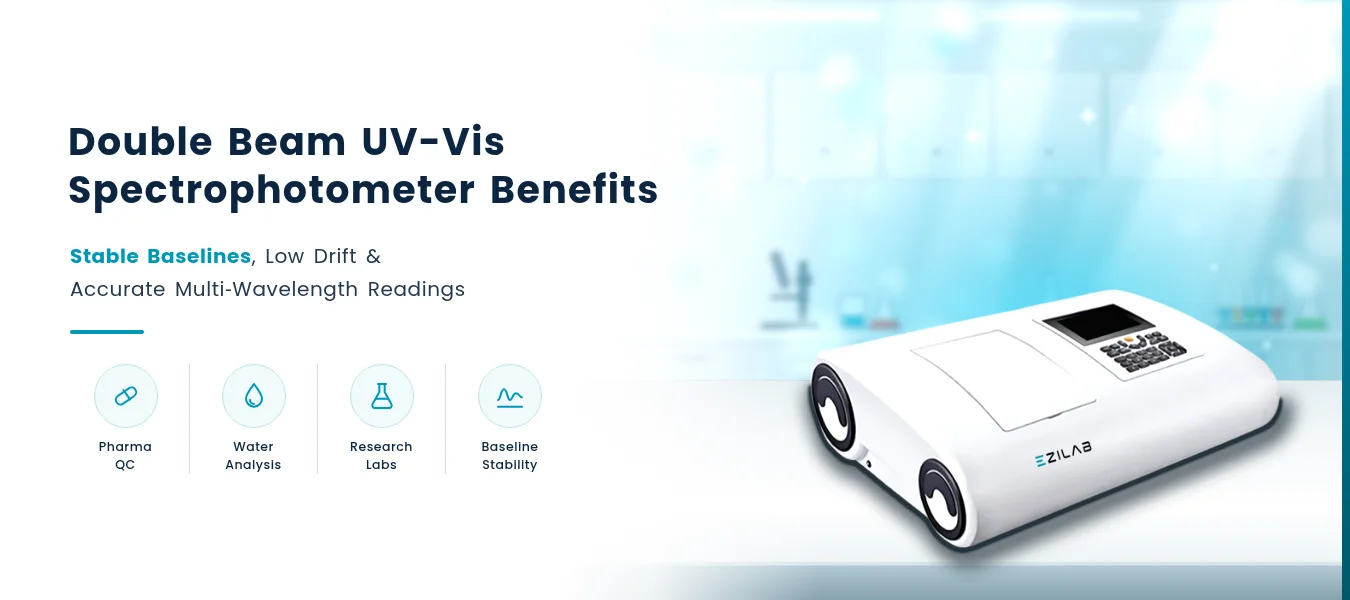
How a live reference beam keeps absorbance data steady across long scans, kinetic runs and multi-wavelength methods.
Why Baseline Stability Decides UV-Vis Data Quality
Lamps age and detectors respond to temperature. On a single beam instrument, those small shifts land directly in the absorbance value, so a full-spectrum scan or a long enzyme assay can slowly wander away from the truth. In pharmaceutical QC, that wander can push a borderline assay result across a limit. In water analysis, it can make the last sample in a long run read differently from the first.
The Ezilab Double Beam UV-Vis Spectrophotometer EZL-DBS102 addresses this at the optical level. It covers 190 to 1100 nm, offers selectable 0.5, 1, 2 and 4 nm bandwidths, uses deuterium and tungsten lamps and holds stability to ≤0.0005 A/h. This article explains how that design works and how to get consistent results from it.
Double Beam UV Visible Spectrophotometer Principle
The double beam UV visible spectrophotometer principle rests on the Beer–Lambert law: absorbance equals the product of molar absorptivity, path length and concentration. Measure how much light a sample absorbs at a chosen wavelength, and you can calculate how much analyte it contains.
The double beam layout adds a live reference. Light from one source is split so that one beam passes through the sample and the other through a blank. Because both beams see the same lamp, the same grating and the same detector at nearly the same moment, any change in source output or electronics cancels in the ratio. What remains is the absorbance of the sample itself.
Double Beam UV Visible Spectrophotometer Diagram
A double beam UV vis spectrophotometer diagram follows the light from source to readout. The path below shows how the EZL-DBS102 handles it.
Diagram: optical path, parts numbered 1–7
When baselines turn noisy, this layout points to the usual suspects: a dirty or mismatched cuvette at stages 4–5, or an aging lamp at stage 1.
Double Beam Spectrophotometer Working vs Single Beam
Double beam spectrophotometer working removes the time gap that single beam designs depend on.
| Factor | Double beam | Single beam |
|---|---|---|
| Blank measurement | Continuous, alongside the sample | Once, before the sample |
| Lamp drift correction | Automatic, in real time | None between re-blanks |
| Long scans and kinetics | Stable baseline | Drift builds over time |
| Warm-up sensitivity | Low | Higher |
| Typical role | QC assays, full scans, research | Routine single-wavelength checks |
A single beam spectrophotometer still suits simple colorimetric checks, and the category includes units such as the EZL-US115 single beam model for that work. For assays where drift matters, the double beam UV spectrophotometer is the safer choice.
Stability, Drift Control and Multi-Wavelength Accuracy
Superior Baseline Stability
Continuous reference correction keeps full-spectrum baselines flat, so small peaks are not lost in drift.
Reduced Drift
≤0.0005 A/h stability supports long kinetic runs and enzyme assays without frequent re-blanking.
Multi-Wavelength Accuracy
±0.1 nm wavelength accuracy and 0.1 nm repeatability keep each reading where the method expects it.
Low Stray Light
≤0.03 %T stray light protects linearity at high absorbance and in impurity checks.
Selectable Bandwidth
0.5 nm sharpens closely spaced peaks; 4 nm boosts signal for dilute samples.
Automatic Calibration
Self-calibration at startup saves setup time and reduces operator error.
EZL-DBS102 Technical Specifications
| Parameter | Value |
|---|---|
| Optical system | Double beam, 1200 lines/mm grating |
| Wavelength range | 190 – 1100 nm |
| Bandwidth | 0.5 / 1 / 2 / 4 nm |
| Wavelength accuracy | ±0.1 nm or ±0.3 nm |
| Wavelength repeatability | 0.1 nm |
| Photometric accuracy | ±0.2 %T (0–100 %T) |
| Photometric repeatability | ≤0.1 %T (0–100 %T) |
| Photometric range | -0.3 to 3 A; 0–200 %T; concentration 0–9999 |
| Stray light | ≤0.03 %T at 220 nm and 360 nm |
| Stability | ≤0.0005 A/h at 250 nm and 500 nm |
| Light source | Deuterium lamp and tungsten lamp |
| Display / output | 320 × 240 dot LCD; USB and parallel port |
| Power | AC 110/220 V, 50/60 Hz |
| Supplied with | PC software, 4 glass + 2 quartz 1 cm cuvettes, dust cover |
UV Double Beam Spectrophotometer Uses
Pharmaceutical QC
Raw material identity, active ingredient assay, drug release testing and batch purity checks.
Water Analysis
Nitrate, phosphate, iron and color measurements across long sample runs.
Research Labs
Nucleic acid quantification, protein assays, enzyme kinetics and spectral scans.
Food Testing
Colorimetry and additive checks on raw and finished products.
These uv double beam spectrophotometer uses share one need: data that holds steady over time. Labs that need fixed-bandwidth or higher-throughput options can compare them in the Ezilab double beam UV-Vis range.
Common Selection Mistakes
Judging by range alone. Most units cover 190–1100 nm; stray light and drift separate them.
Ignoring bandwidth. A fixed wide slit can blur closely spaced peaks in pharmacopeial methods.
Forgetting quartz cuvettes. Glass absorbs below about 340 nm and hides UV peaks.
Skipping data export. Confirm PC software and USB output fit your reporting workflow.
Overlooking lamp access. Check how easily deuterium and tungsten lamps can be replaced.
Comparing double beam UV vis spectrophotometer manufacturers on brochures only. Ask about spare lamps, service response and training.
User Tips for Stable, Repeatable Readings
- Let the lamps warm up and the startup calibration finish before measuring.
- Use matched cuvettes of the same material and path length in both beams.
- Handle cuvettes by the frosted sides and wipe clear windows with lens tissue.
- Fill the reference cuvette with the same solvent or buffer as the samples.
- Dilute samples that read above about 2 A to stay in the linear range.
- Check wavelength accuracy with holmium oxide filters at set intervals.
- Track lamp hours and replace lamps before noise rises.
Exploring the Double Beam UV-Vis Category
This category groups double beam spectrophotometer models by bandwidth and control options, from fixed 1 nm and 1.8 nm units to selectable and fine-step variable designs, alongside single beam models for routine checks. Buyers usually compare bandwidth flexibility, stray light, stability, scan features, software and data output against their methods.
You can review each beam spectrophotometer in the full Ezilab spectrophotometer collection, or browse other analytical instruments from the Ezilab.
| Model | Wavelength range | Bandwidth |
|---|---|---|
| EZL-DBS100 / EZL-DBS103 | 190 – 1100 nm | 1.8 nm |
| EZL-DBS101 / EZL-DBS104 | 190 – 1100 nm | 1 nm |
| EZL-DBS102 / EZL-DBS105 | 190 – 1100 nm | 0.5 / 1 / 2 / 4 nm |
| EZL-DBS106 | 190 – 900 nm | 0.1 – 5 nm (0.1 nm steps) |
| EZL-US121 | 190 – 1100 nm | 0.5 / 1 / 2 / 4 / 5 nm |
| EZL-US122 | 190 – 1100 nm | 1 or 2 nm |
| EZL-US123 | 190 – 1100 nm | 1.8 nm |
| EZL-US132 | 190 – 1100 nm | 2 nm |
Bring Steadier Baselines to Your Bench
Review the complete specifications, accessories and software details of the EZL-DBS102 double beam UV-Vis system before planning your method setup.
Explore EZL-DBS102Amelia Brooks
Blog Content Writer at Ezilab Scientific
Amelia Brooks is a blog content writer at Ezilab Scientific, specializing in laboratory equipment, scientific instrumentation, and technical content development. She focuses on translating complex product specifications and scientific concepts into clear, informative, and engaging articles. Her writing highlights equipment features, practical applications, and industry developments to help readers understand laboratory technologies and make informed decisions based on their technical requirements.